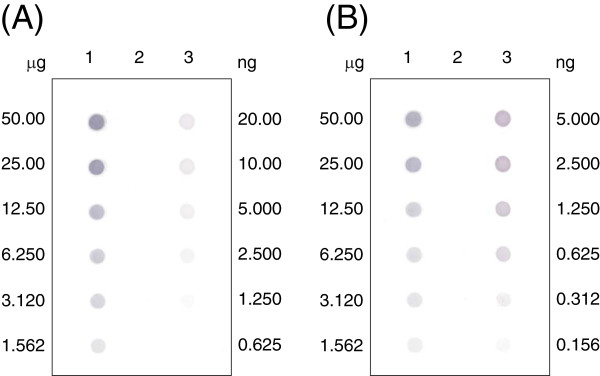
Figure 4.

Dot blot quantification of the amount of fusion proteins in the spore coat. Panel A. Indicated (left) is the concentration of coat proteins isolated from: Lane 1 - BKH102, Lane 2 – 168, Lane – 3 – purified UreA protein, concentration indicated on the right. Panel B. Indicated (left) is the concentration of coat proteins isolated from: Lane 1 - BKH124, Lane 2 – 168, Lane – 3 – purified UreA protein, concentration indicated on the right.
