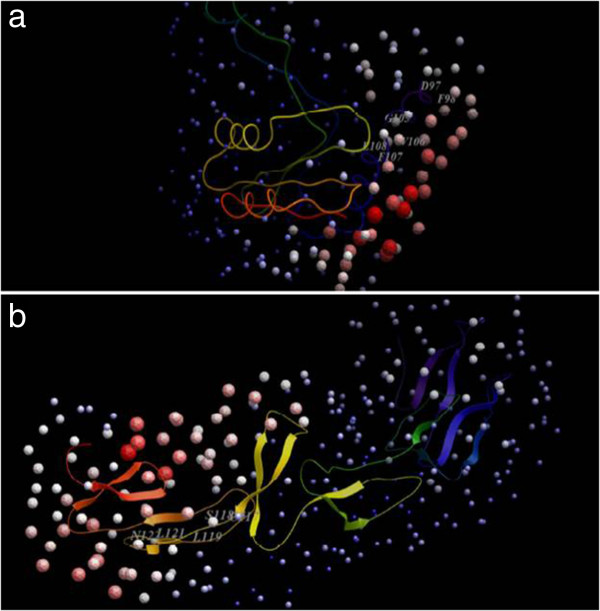
Figure 3.

Likely hotspots in HP986 (a) and TNFR1 (b) as identified by Optimal Docking Area tool. The regions denoted by light red spheres likely to be involved in an interface are labeled with first few residues each of which is identified by MetaPPISP also.
