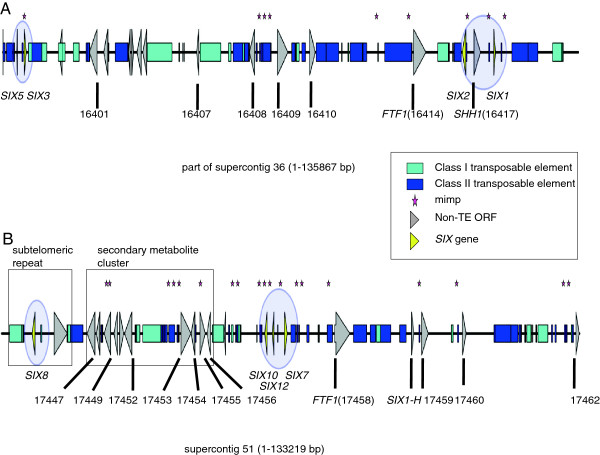
Figure 3.
Details of two class II TE-enriched chromosomal subregions with SIX gene mini-clusters. Schematic representations of two equally large regions of the Fol4287 pathogenicity chromosome: (A) part of supercontig 2.36 and (B) supercontig 2.51. Numbers represent FOXG gene numbers. Italic descriptions highlight interesting genes as reference points. Boxes indicate the telomeric repeat region and the putative secondary metabolite gene cluster. The genomic maps were drawn to scale.

