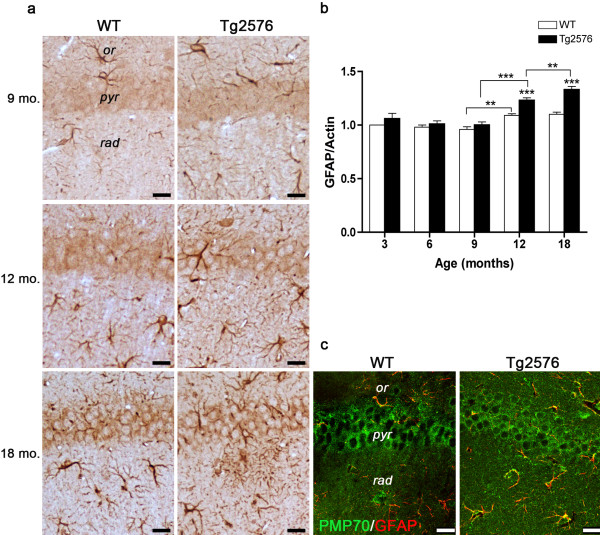
Figure 3.
GFAP protein levels and distribution in the hippocampus of WT and Tg mice. (a) GFAP immunohistochemical localization in CA1 hippocampal field of 9-, 12-, and 18-month-old WT and Tg mice. or, stratum oriens; pyr, stratum pyramidale; rad, stratum radiatum. Scale bars, 25 μm. (b) Densitometric analysis of GFAP WB performed on hippocampal protein extracts of 3-, 6-, 9-, 12-, and 18-month-old mice. Values are expressed as mean ± SD. **P < 0.01; ***P < 0.001. (c) Double immunofluorescence of PMP70 (green) in combination with GFAP (red) in the CA1 hippocampal field of 18-month-old WT and Tg brain. Several PMP70+/GFAP+ cells (yellow) are especially numerous in the pathological genotype. Scale bars, 25 μm.

