
Figure 2.
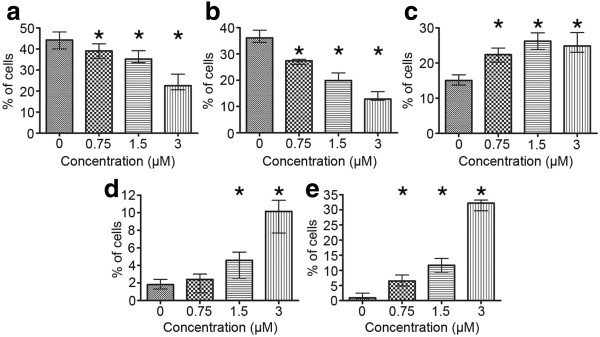
a-e Cell cycle distribution of A549 cells after treatment with etoposide - statistical data from flow cytometric analyses (staining with RNase/PI). a Cells with DNA content typical of G0/G1 phases of the cell cycle, b cells with DNA content typical of S phase, c cells with DNA content typical of G2/M phases, d cells with DNA content typical of subG1 fraction, e cells with DNA content typical of polyploidy. Statistically significant differences as compared to the control cells are marked by asterisks (Mann–Whitney U statistics, P<0.05). Columns - median percentage of cells, bars - interquartile range. Results are representative of five independent experiments.