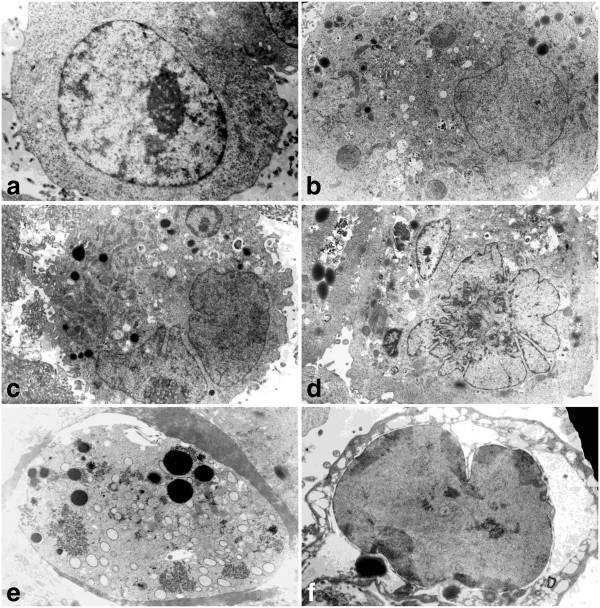
Figure 7.
a-f Morphological and ultrastructural changes in A549 cells after treatment with etoposide - electron microscopic examination. a Control cells (x 7 000), b 0.75 μM etoposide (x 5 000), c, d 1.5 μM etoposide (x 4 000), e, f 3 μM etoposide (x 6 000). Progressive alterations in the nucleus and cytoplasm area are evident. At the highest concentration some cells displayed features of extensive lysis/demolition of the cellular content, including dispersed chromatin-like structures appearing in the cytoplasm. Results are representative of five independent experiments.

