
Figure 9.
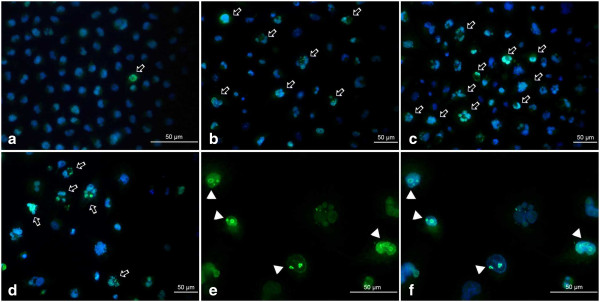
a-f Immunolocalization of cyclin D1 in A549 cells after treatment with etoposide - fluorescence microscopic examination (cyclin D1 indirect labeling, secondary antibody was goat anti-mouse IgG-Alexa Fluor 488®). a Control cells, b 0.75 μM etoposide, c 1.5 μM etoposide, d, e, f 3 μM etoposide. Enhanced fluorescence signal in selected cells and cyclin D1 aggregations indicated (arrows, arrowheads). Nuclei were counterstained with DAPI. Results are indicative of three independent experiments. Bar 50 μm.