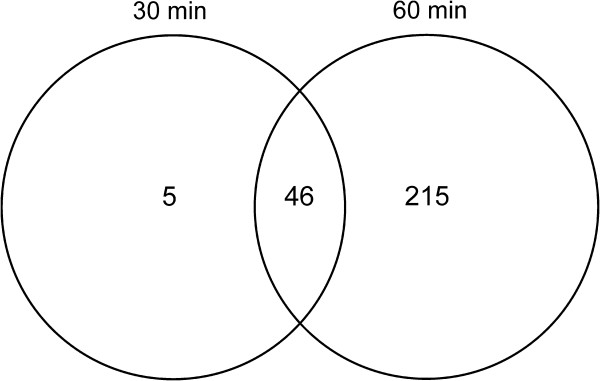
Figure 2.

Venn diagram of gene expression in 30 min and 60 min treated E. coli MG1655. Time course analysis of differentially expressed genes, reveals number of genes induced following 30 min and 60 min exposure to subinhibitory concentrations of colicin M.
