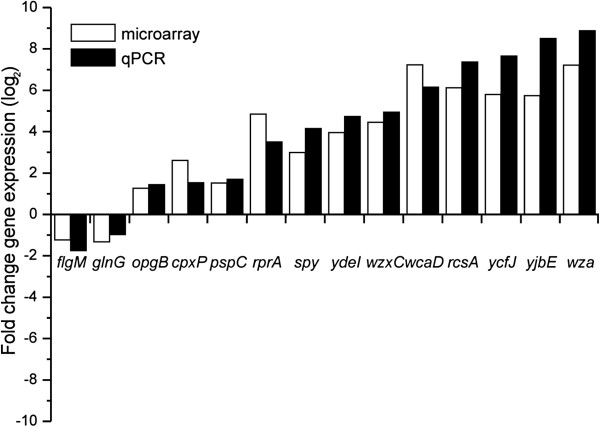
Figure 3.
Validation of the microarray results by qPCR. Expression analysis of the 14 selected genes determined by microarray (open bars) and validated by qPCR (solid bars). The fold-changes for the microarray and qPCR were calculated as described (Materials and Methods) and represent gene expression levels following 60 min exposure to colicin M.

