Figure 1.

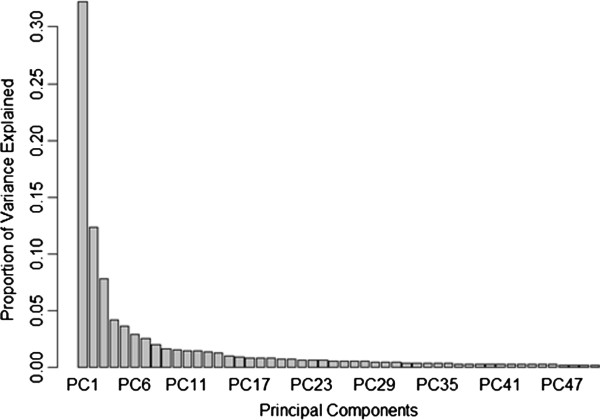
Proportion of variance in the descriptor set that is explained by each principal component (for readability the plot was truncated after the fiftieth variable).

Proportion of variance in the descriptor set that is explained by each principal component (for readability the plot was truncated after the fiftieth variable).