
Figure 1.
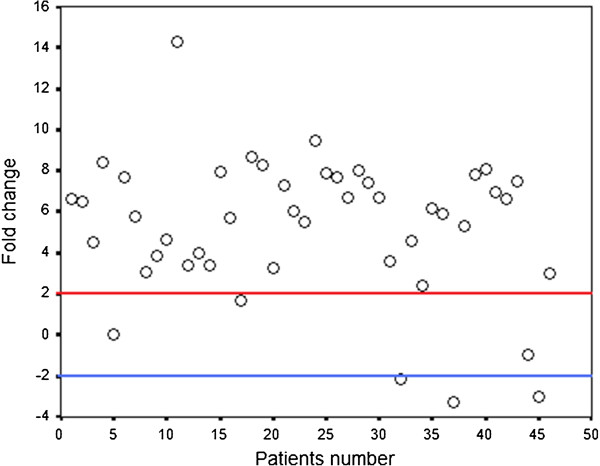
Scatter plot representative of descriptive analysis of relative gene expression distribution of SALL4 in patients with CRC. The Y axis indicates the relative gene expression, and the X axis represents the patients. Relative mRNA expression of more than two-fold in tumor tissues is considered as overexpression, less than minus two-fold as underexpression, and the range in-between is defined as normal.