
Figure 2.
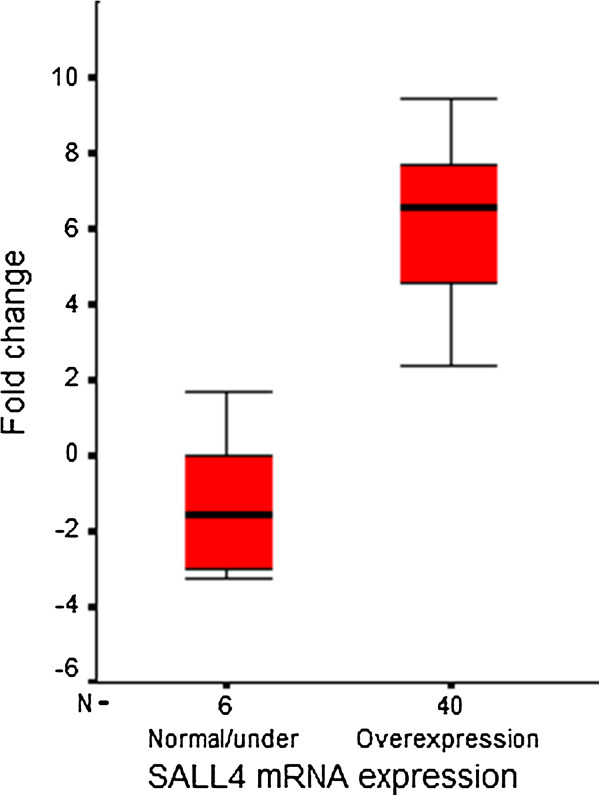
Box plot representative of relative mRNA expression of SALL4 in CRC patients. Quantitative analysis of SALL4 is represented as box plots. The Y axis indicates the fold change of relative mRNA expression, and the X axis represents patient groups. Box plots represent the lowest, lower quartile, median, upper quartile, and highest observations of fold changes in patients either with normal/underexpressed or overexpressed SALL4.