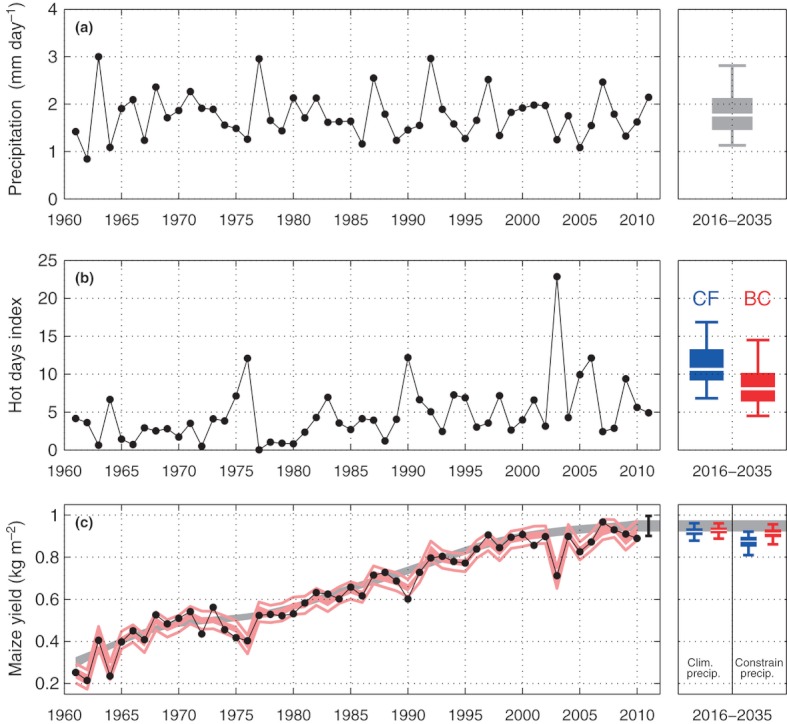
Figure 2.

Historical observations and future projections of climate and maize yield for France. (a) Mean JJA precipitation, averaged over all grid cells in France and weighted by the fraction of maize grown. (b) Number of JJA days with Tmax over 32 °C from the E-OBS data set (Haylock et al., 2008), averaged over all grid cells in France and weighted by the fraction of maize grown. (c) French maize yields from FAOSTAT (black points; http://faostat.fao.org/) and empirical model predictions for the technology trend (grey shading) and expected yield (red shading) with total uncertainties (red lines), using Eqn (1) and considering both temperature and precipitation. The black error bar indicates the forecast for 2011, assuming a flat technology trend since 2010. For the 2016–2035 periods, the boxes show the 25th–75th percentiles and the whiskers indicate the 5th and 95th percentiles. The climatological distribution for JJA precipitation is shown (top), along with the projected and calibrated number of hot days using bias correction (BC) and change factor (CF) methods (middle). The yield projections (bottom) assume a flat technology trend and are shown for both climatological precipitation and precipitation constrained by historical correlations between temperature and precipitation.
