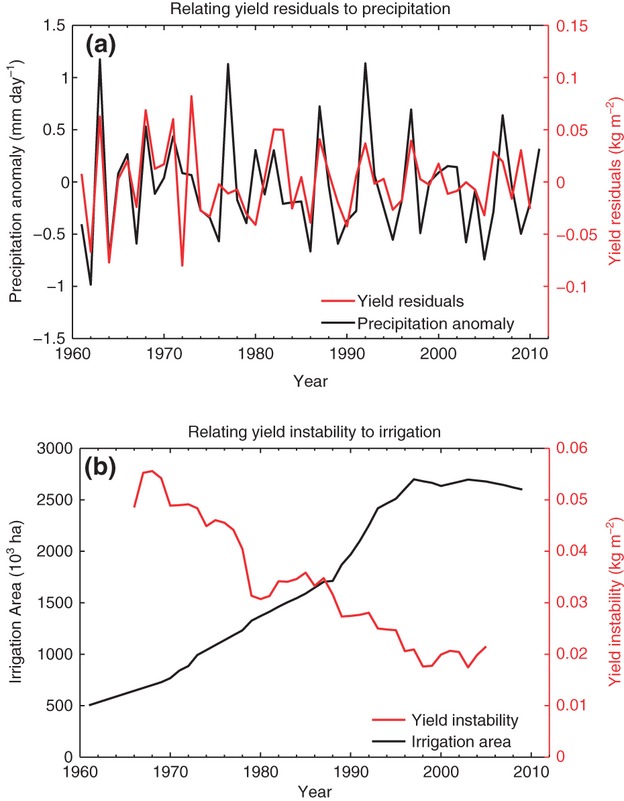
Figure 3.

The temperature-only empirical model. (a) The residuals from the expected yield [Eqn 4] as a function of time (red) and precipitation anomaly (black). (b) The running 11-year standard deviation of yield residuals (red), showing a decrease over time, indicating higher yield stability, and the area of irrigation in France from FAOSTAT (black).
