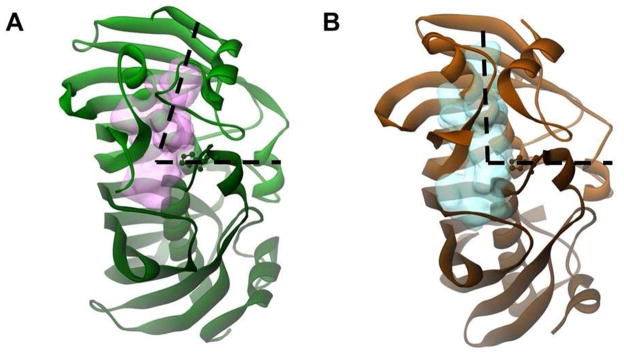
Figure 9. Comparison of Active Site Tunnels Between FabA and FabZ.

The enzyme backbones are drawn with solid ribbons, the catalytic histidines are shown with scaled balls and sticks. (A) Fab A (PDB#1MKA), the dehydratase–isomerase, in green with the active site volume indicated by a faint pink cloud. (B) P. aeruginosa Fab Z (PDB#1U1Z), the standard dehydratase, in orange with the active site volume indicated by a faint blue cloud. Note the shorter binding tunnel in FabA and the slight difference in the angle of the two tunnels (indicated with dashed lines), hypothesized to allow for C-3 cis double bond formation in FabA.
