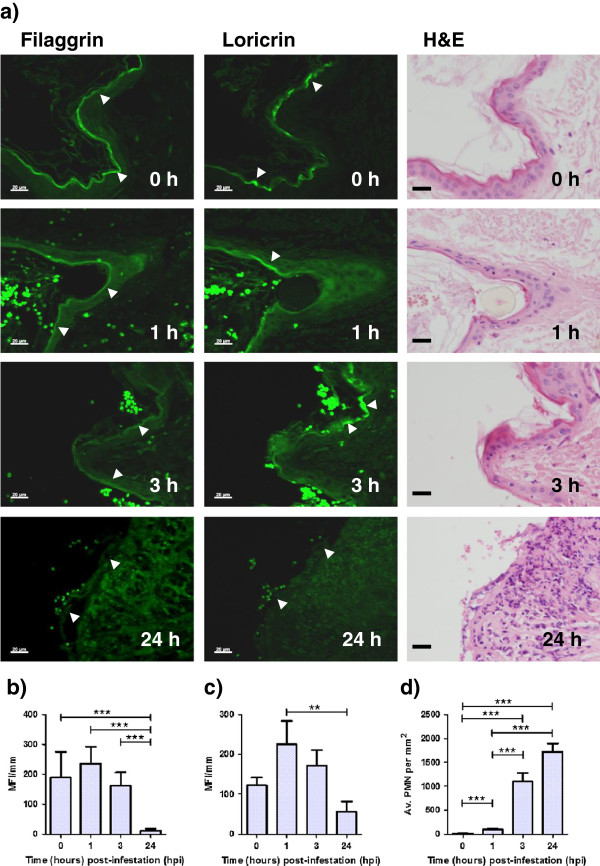
Figure 3.
Immunohistochemical labelling of filaggrin and loricrin and changes in skin histopathology following P. ovis infestation. (a) Representative images of fluorescence immunohistochemical (IHC) labelling of filaggrin and loricrin and H&E stained sections from one sheep at time 0, 1, 3 and 24 hpi. Scale bars represent 20 μm. Mean fluorescence intensity (MFI)/mm epithelium for filaggrin (b) and loricrin (c) IHC labelling at time 0, 1, 3 and 24 hpi. (d) Mean polymorphonuclear cell counts/mm2 at time 0, 1, 3 and 24 hpi. ** = p < 0.01, *** = p < 0.001. Error bars show standard error of the mean (SEM).

