Fig. 3.

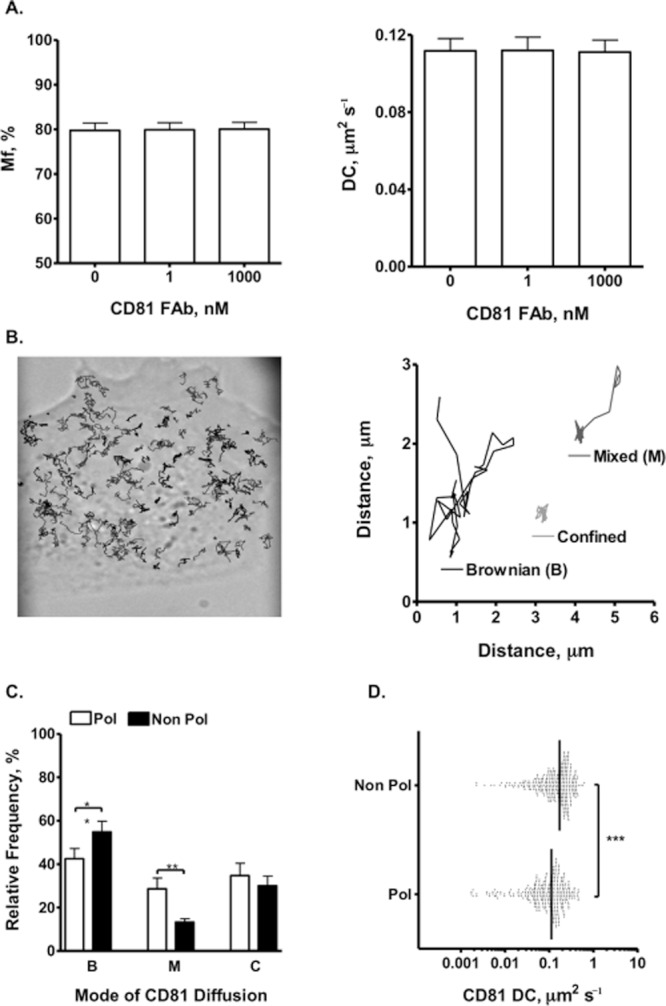
Single particle tracking of CD81 in polarized and non-polarized HepG2 cells. Initial studies assessed the effect of anti-CD81 2s66 Fab on AcGFP–CD81 mobility by FRAP methodology. Anti-CD81 2s66 Fab was pre-incubated with cells for 1 h prior to FRAP imaging. The Fab had no significant effect on CD81 mobility or immobile fraction of DC (A). The image (B) shows CD81 trajectories at the non-polarized HepG2 cell surface and the cartoon depicts representative trajectories with Brownian (B), mixed (M) or confined (C) behaviour. The relative frequency of anti-CD81 2s66 trajectories in polarized (Pol – white bars) and non-polarized (Non Pol – black bars) cells is shown (C). Scatter plots for diffusion coefficients calculated from the MSD-τ plots for Brownian trajectories in polarized and non-polarized cells, where each point represents one trajectory with the black line indicating the median, are represented (D). Total and Brownian CD81 DCs are summarized in Table 1. BMC sampling was utilized to present equivalent trajectories per parameter, where a minimum of 10 cells and 250 trajectories were measured. Non-parametric Mann–Whitney t-tests were used to determine the degree of significance (*P < 0.05, **P < 0.001, ***P < 0.0001).
