
Fig. 6.
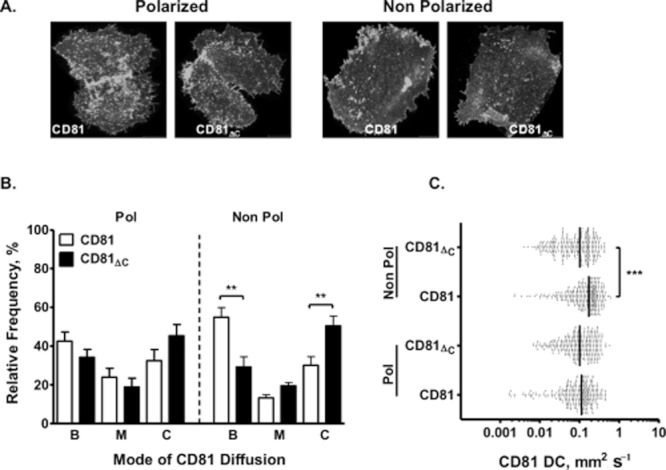
CD81 C-terminus regulates protein diffusion and confinement. HepG2 cells were transfected to express wild-type or CD81ΔC, and representative confocal images of polarized (day 7 post plating with a polarization index of 44%) and non-polarized (day 1 post plating with a polarization index of 1%) HepG2 cells taken at the cell–glass interface are shown (A). The images were acquired using a 100× 1.4NA objective on the Zeiss LSM 780 confocal with 0.8 μm Z sections. The relative frequency of wild-type (white bars) and CD81ΔC (black bars) Brownian (B), mixed (M) or confined (C) trajectories on polarized (B: 42 ± 5%, 34 ± 4%, M: 24 ± 5%, 19 ± 4%, C: 32 ± 6%, 45 ± 6%) and non-polarized (B: 55 ± 5%, 29 ± 5%, M: 13 ± 2%, 20 ± 2%, C: 30 ± 5%, 50 ± 5%) HepG2 cells is shown (B). Scatter plots of CD81 and CD81ΔC Brownian DC calculated from the MSD-τ plots for Brownian trajectories in polarized (0.11, 0.10 μm2 s−1) and non-polarized (0.17, 0.10 μm2 s−1) cells are shown, where each point represents one trajectory with the vertical line indicating the median (C). Total and Brownian CD81 DCs are summarized in Table 1. A minimum of 10 cells and 250 trajectories were measured per parameter as determined by BMC sampling. Non-parametric Mann–Whitney tests were used to determine the degree of significance (*P < 0.05, **P < 0.001, ***P < 0.0001).