Fig. 7.

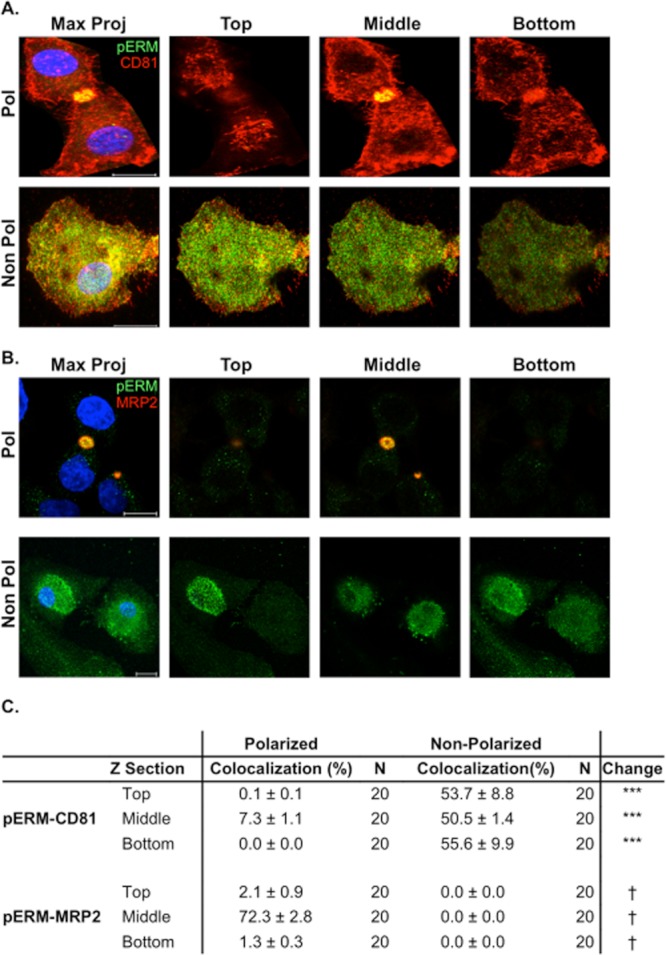
Phosphorylated ERM and CD81 localization in polarized and non-polarized HepG2 cells. Confocal images of HepG2 cells costained with anti-phosphorylated ERM (pERM) (green) and anti-CD81 (red) (A) or anti-MRP2 (red) (B). Sixteen bit images were acquired with optimal pixel resolution using a 100× Plan Apochromat 1.4NA oil immersion objective on a Zeiss LSM 780 confocal microscope. Representative maximum projections, constructed from Z sections (0.44 μm thick sections per cell) of polarized and non-polarized HepG2 cells, are shown. Representative Z sections from the top, middle or bottom of the cell are shown, with the bottom being closest to the glass. Cell nuclei were counter-stained with DAPI. Scale bars represent 10 μm. Quantitative pERM–CD81 and pERM–MRP2 colocalization analysis at different Z positions (top, middle and bottom) were calculated in accordance with Zinchuck et al. The colocalization coefficient is weighted for either CD81 or MRP2 expression (C), with the background threshold determined by the fluorescent signal of control isotype-matched IgG-stained HepG2 cells and set as twice the background fluorescent signal plus 3 SD. The change in colocalization between polarized and non-polarized cells was compared using a Mann–Whitney test (***P < 0.001); no MRP2 expression was detected in non-polarized cells (†).
