
Figure 6.
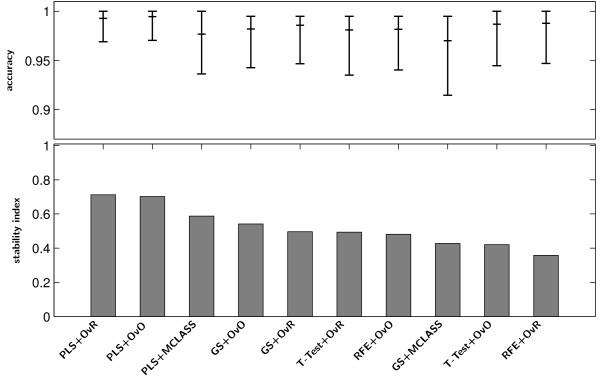
Stability index s2 (bar chart) and accuracy of classification (dot chart) with the 95% confidence interval of the best classifier on the tested feature selection methods for MLL data.
Official websites use .gov
A
.gov website belongs to an official
government organization in the United States.
Secure .gov websites use HTTPS
A lock (
) or https:// means you've safely
connected to the .gov website. Share sensitive
information only on official, secure websites.
Stability index s2 (bar chart) and accuracy of classification (dot chart) with the 95% confidence interval of the best classifier on the tested feature selection methods for MLL data.