
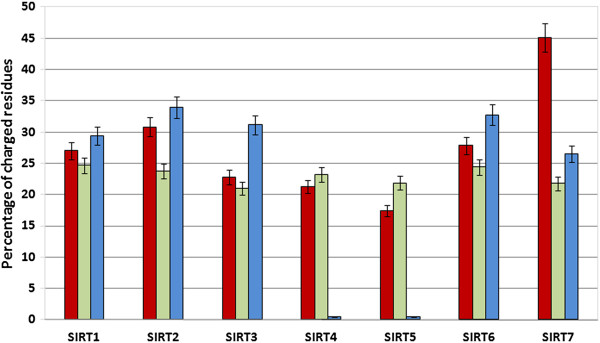
Figure 2.
Analysis of charged residue presence. We report the average percentages of charged residues in sirtuin families. Bars for N-terminal, catalytic core and C-terminal regions are reported in Red, Green and blue, respectively.
Official websites use .gov
A
.gov website belongs to an official
government organization in the United States.
Secure .gov websites use HTTPS
A lock (
) or https:// means you've safely
connected to the .gov website. Share sensitive
information only on official, secure websites.
Analysis of charged residue presence. We report the average percentages of charged residues in sirtuin families. Bars for N-terminal, catalytic core and C-terminal regions are reported in Red, Green and blue, respectively.