
Figure 1.
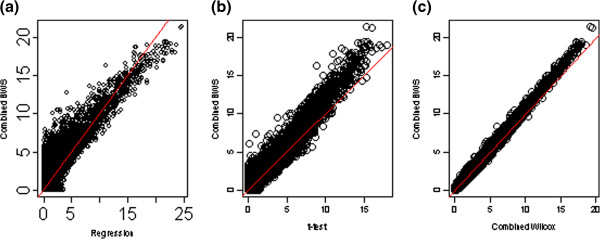
Scatter plots for negative log10 p-values based on different methods. The left panel is for the comparison between combined DWS and linear regression. The middle panel is for the comparison between combined DWS and combined t-test. The right panel is for the comparison between combined DWS and combined Wilcoxon test.