


Figure 2.
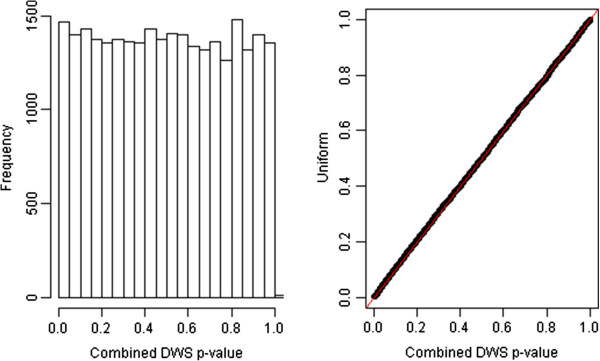
Test the distribution of p-values by applying the proposed method to a newly created case–control data based on the samples from the original control group. The left panel is for the histogram and the right is a qq-plot against the uniform [0,1] distribution.