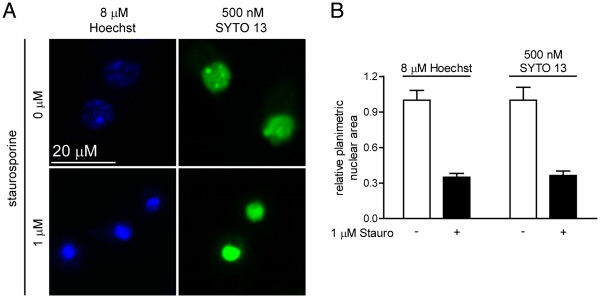
Figure 2.

End-point assays of control and staurosporine-treated neurons exhibit identical outcomes at 6 h. (A) End-point characterization of nuclear morphology 6 h after addition of vehicle (top panels) or staurosporine (bottom panels). Neurons were visualized using PI plus either Hoescht (blue) or SYTO 13 (green). Note that neither vehicle nor staurosporine addition caused necrotic cell death. (B) Planimetric measurements of nuclear size. * represent p < 0.01.
