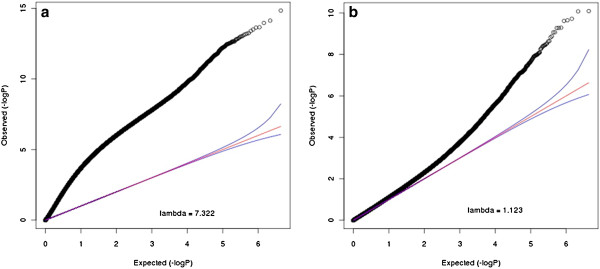
Figure 4.

QQ plot and lambda of the methylome-wide association tests before PCA and after PCA on the schizophrenia data set. (a) shows the QQ plot and lambda without including PCs in the association test. (b) shows the QQ plot and lambda including PCs in the association test.
