
Figure 1.
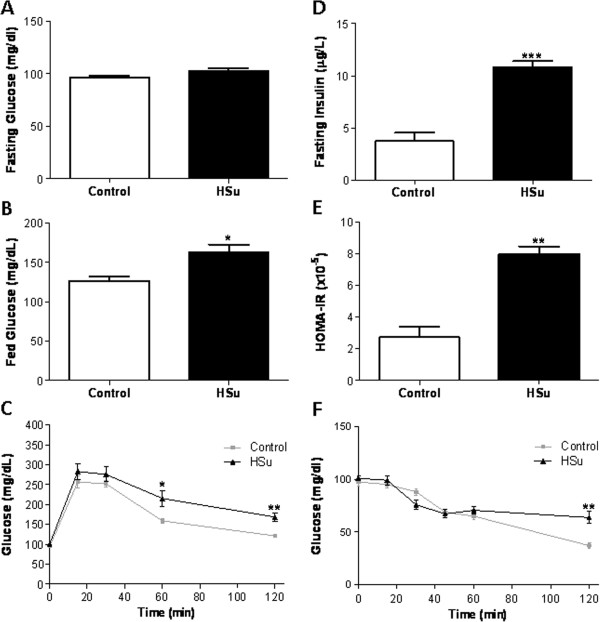
Metabolic characterization of the prediabetic animal model. Glycemic and insulinemic profile: fasting glucose (A), fed glucose (B), glucose tolerance test (C), fasting insulin (D), HOMA-IR index (E) and insulin tolerance test (F), after 9 weeks of treatment. (Results are mean ± SEM; n = 7 per group. *p < 0.05; **p < 0.01, ***p < 0.001 versus Control group).