
Figure 2.
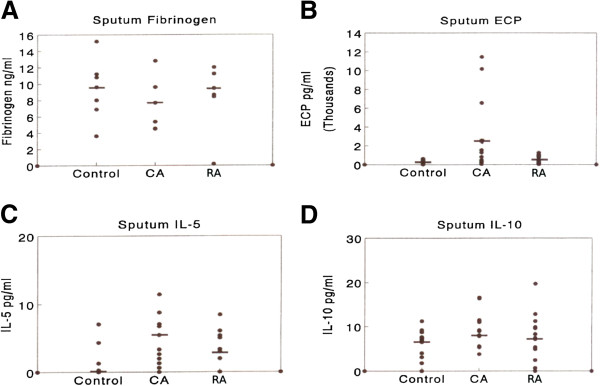
Sputum mediator measurements from matched triplets of RA, CA and control group subjects (A) sputum fibrinogen, (B) sputum ECP, (C) sputum IL-5 (D) sputum IL-10. Each point represents individual values or multiple identical values. Median values are denoted by bars. Significant (p < 0.05) differences in mediator levels between RA and CA groups were observed for sputum ECP and sputum IL-5 but not for sputum fibrinogen or sputum IL-10.