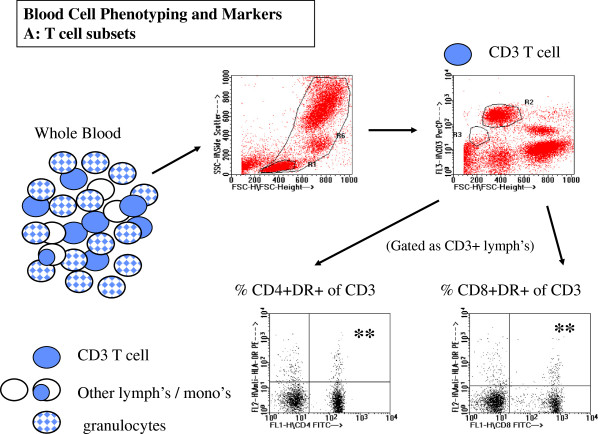
Figure 5.
Representative data for flow cytometry analysis of T lymphocyte subsets and their activation or differentiation markers. CD3+ T lymphocytes (top right, R2 region) were first identified from whole blood cells defined by FSC and SCC (top left, R6 region). CD3+ T lymphocyte subsets were further defined by expression of CD4, CD8, and activation/differentiation markers such as HLA-DR (lower panels).

