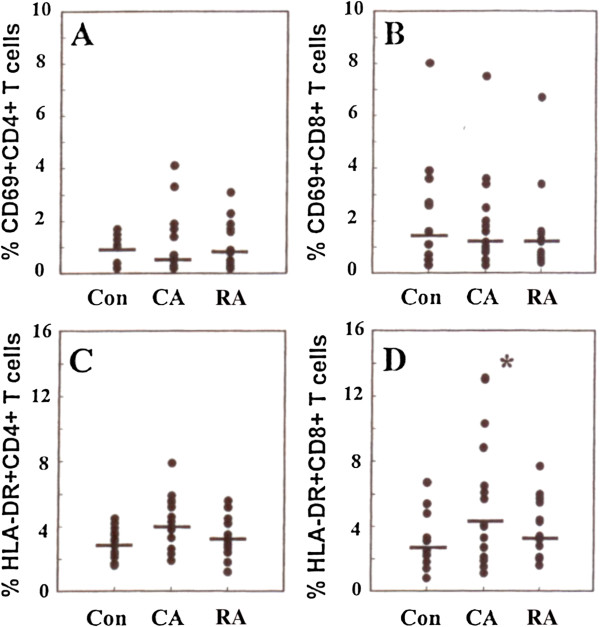
Figure 9.
The expression of activation markers on CD4 and CD8 T-cell subsets in blood from RA CA and control groups of subjects. (A) percentage of CD69 positive CD4 positive T-cells. (B) percentage of CD69 positive CD8 positive T-cells. (C) percentage of HLA-DR positive CD4 positive T-cells (D) percentage of HLA-DR positive CD8 positive T-cells. Note significant (P < 0.05) increase in HLA-DR positive CD8 positive T-cells in CA group compared with control group.

