Figure 2.
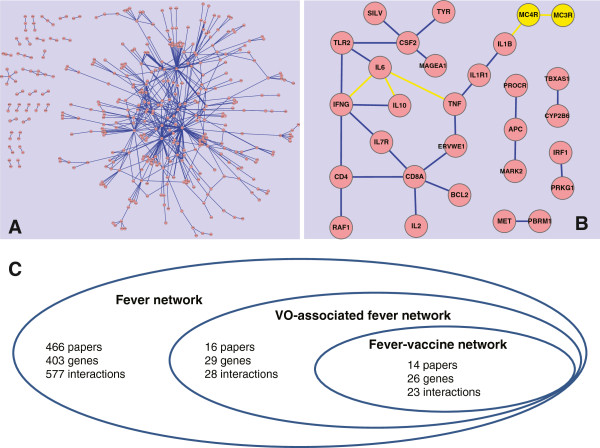
Gene-gene interaction networks in fever and vaccine/VO-associated fever literature. (A) The generic fever-related network. Thickness of edge corresponds to the number of sentences containing its respective interactions. (B) The vaccine/VO associated network. Nodes and edges in yellow were additionally identified by using VO terms. (C) Summary of the three generated gene interaction networks.

