
Figure 2.
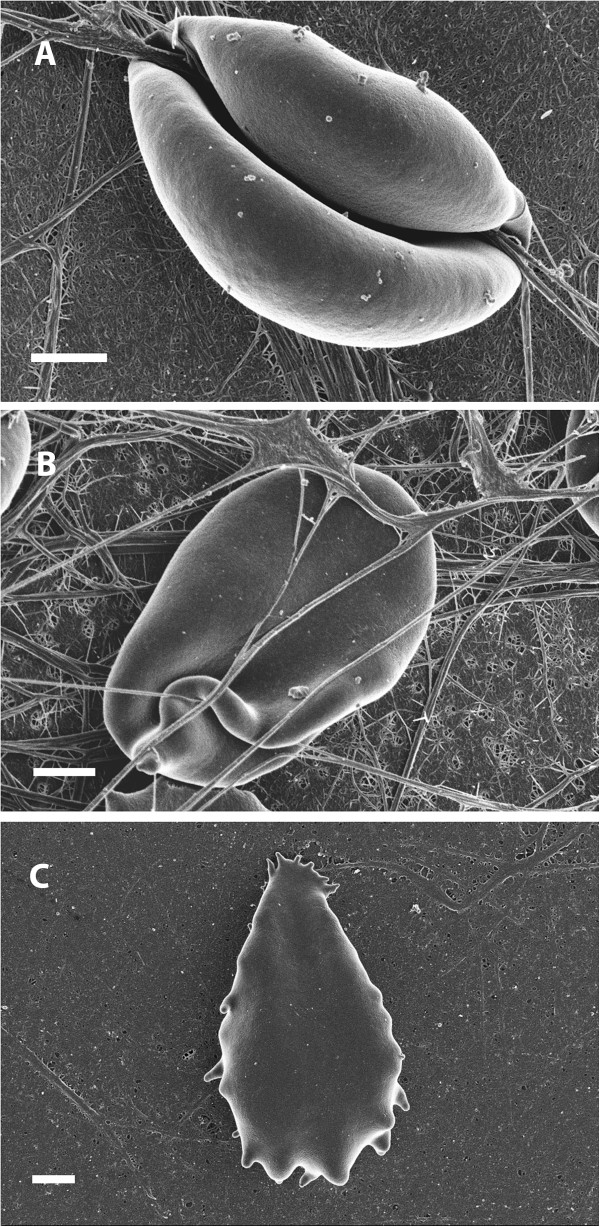
SEM micrograph of an RBC of a diabetic individual. A) RBC with very smooth membrane twisted around spontaneously formed fibrin fibers; B) RBC showing lengthened ultrastructure. C) RBC showing smooth membrane. Scale = 1 μm.
Official websites use .gov
A
.gov website belongs to an official
government organization in the United States.
Secure .gov websites use HTTPS
A lock (
) or https:// means you've safely
connected to the .gov website. Share sensitive
information only on official, secure websites.
SEM micrograph of an RBC of a diabetic individual. A) RBC with very smooth membrane twisted around spontaneously formed fibrin fibers; B) RBC showing lengthened ultrastructure. C) RBC showing smooth membrane. Scale = 1 μm.