
Figure 3.
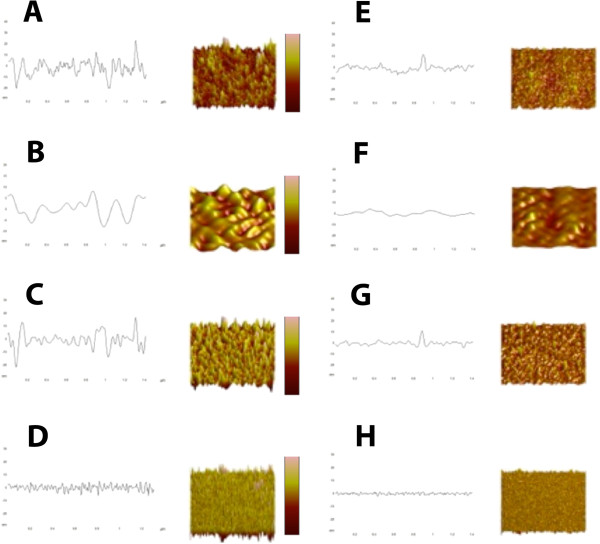
A) Control original profile and surface, z scale = 60nm, x and y scale = 1μm, B) Control first order profile and surface, z scale = 40nm, x and y scale = 1μm, C) Control second order profile and surface, z scale = 40nm, x and y scale = 1μm, D) Control third order profile and surface, z scale = 18nm, x and y scale = 1μm, E) Diabetes original profile and surface, z scale = 60nm, x and y scale = 1μm, F) Diabetes first order profile and surface, z scale = 40nm, x and y scale = 1μm, G) Diabetes second order profile and surface, z scale = 40nm, x and y scale = 1μm, H) Diabetes third order profile and surface, z scale = 18nm, x and y scale = 1μm.