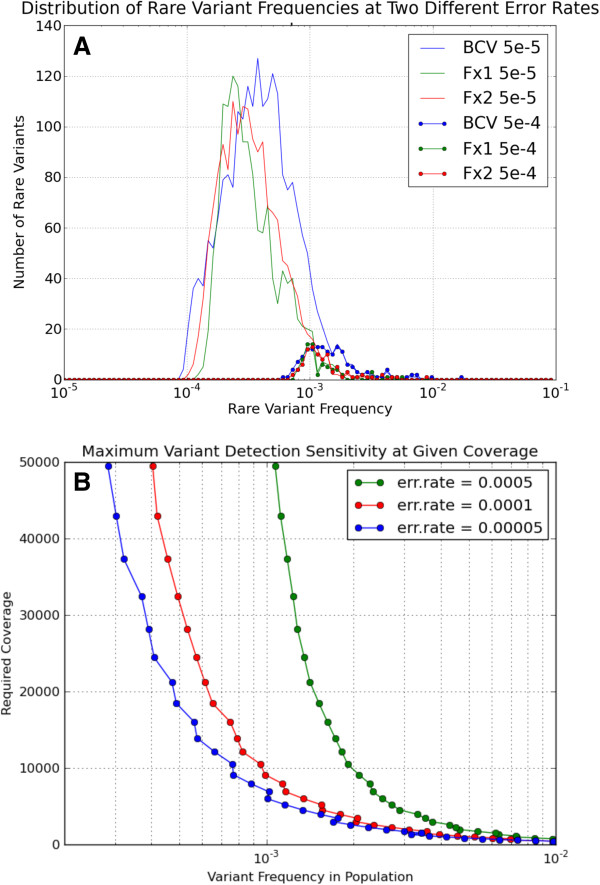
Figure 5.
Sensitivity of rare variant detection using ORP. A. Distributions of rare variant frequencies detected in the three natural samples using two different error rates -- 5×10⁻⁵ (solid lines) and 5×10⁻⁴ (dotted lines) in the binomial variant detection model. B. Theoretical maximum variant detection sensitivity at given coverage level for three different error rates. Coverage level is for usable reads that exhibit the error rate under consideration.

