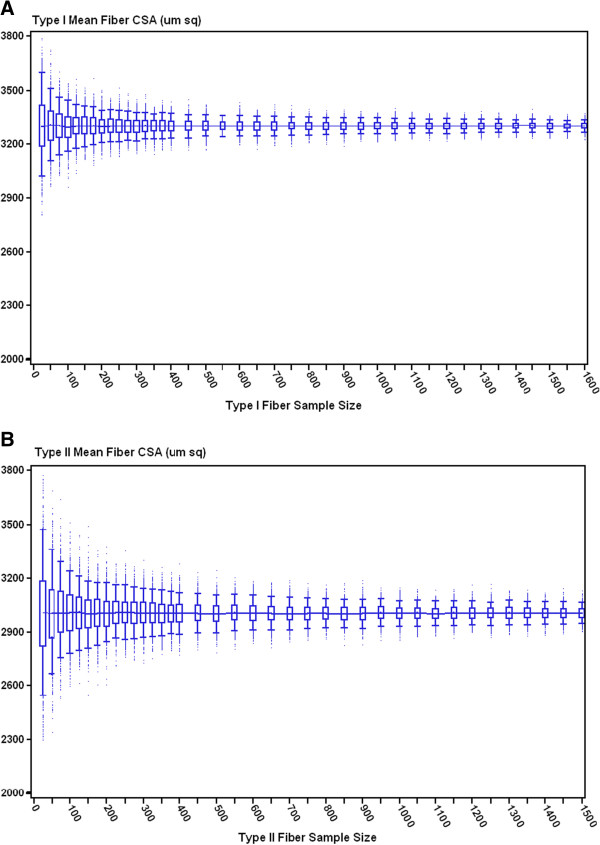
Figure 1.
Box plots of A) bootstrapped mean type I muscle FCSAs by sample size n fibers from a single rat soleus muscle; B) bootstrapped mean type II muscle FCSAs by sample size n fibers from a single rat EDL muscle. The line (—) connecting the box plots represents the median; the box represents the 25th and 75th percentiles; the horizontal bars represent the 5th and 95th percentile confidence limits.

