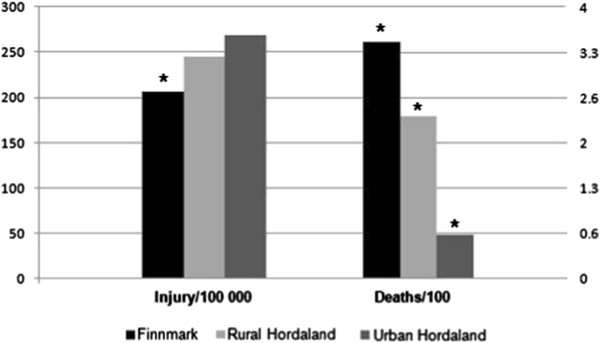
Figure 4.

Road traffic accident data from Statistics Norway for the period 2001 to 2009 involving personal injury: accident rate per 100,000 inhabitants, and deaths per 100 accidents with personal injury per year for each study area. * Statistically significant difference between study areas (p < 0.05).
