
Figure 2.
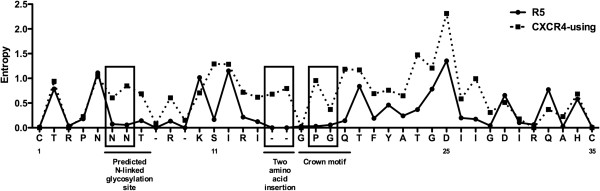
Entropy plot comparing V3 sequence variability between CXCR4-using and R5 C-HIV Envs. The potential N-linked glycosylation site, positions 1, 11, 25 and 35, the position of the two amino acid insertion, and the V3 GPGQ crown motif are highlighted. Boxes illustrate regions of specific interest, where there is variability within CXCR4-using V3 sequences but little or no variability within R5 V3 sequences.