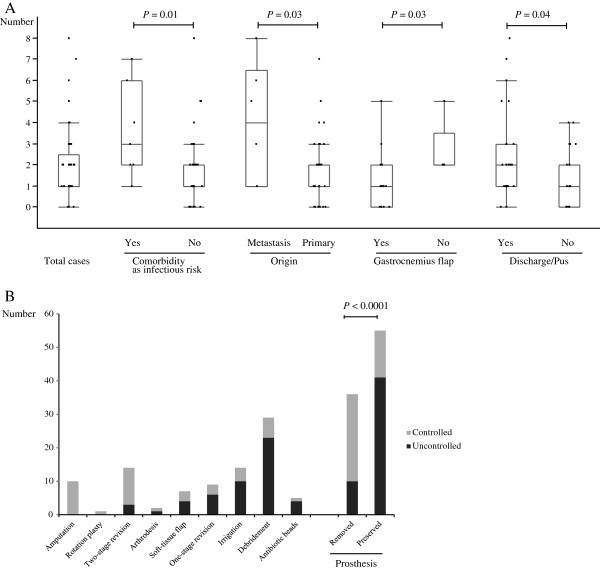
Figure 3.
Box-and-whisker plots showing the distribution of the number of surgical interventions required to control infection (A). Factors significantly influencing the number of surgeries included comorbidity as infectious risk, tumor origin (primary versus metastatic), application of gastrocnemius flap (in the tibia cases), and discharge/pus at the initial presentation of infection. Success rate for each surgical modality (B). The modalities in this figure were arranged in order from higher to lower success rate. Modalities with removal of prostheses were significantly more successful in infection control than those that left the prostheses in place (right two rows).

