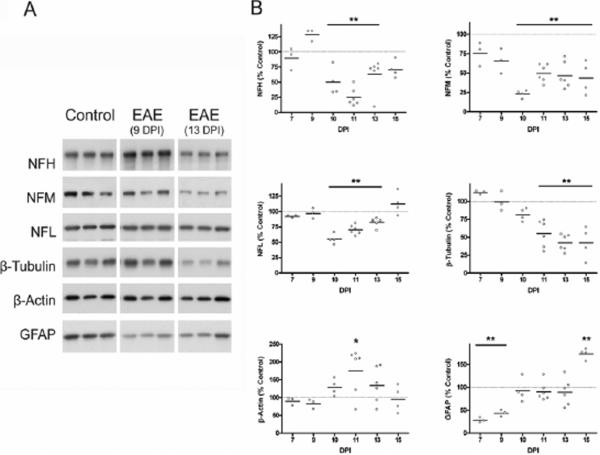
Figure 5.
Levels of cytoskeletal proteins in EAE spinal cord. Spinal cord homogenates from control and EAE animals (5 μg protein) were separated by SDS-PAGE followed by western blotting. Membranes were immunostained with antibodies against six cytoskeletal proteins (3 neurofilament chains, β-tubulin, β-actin, and GFAP). (A) Representative blot with 3 control and 3 EAE samples prepared from animals at 9 and 13 DPI are shown. (B) Levels of each cytoskeletal protein were tracked throughout the disease course and values are expressed as a percentage of the average protein level in control spinal cords. Values for individual animals as well as the mean value (line) are shown at each DPI. Data were analyzed for statistical significance using one-way ANOVA with Dunnett's multiple comparison post-test to determine statistical significance from control, (*) p<0.05, (**) p<0.01. Neurofilaments and β-tubulin are degraded in the disease, which is possibly a consequence of oxidative damage to these proteins.

