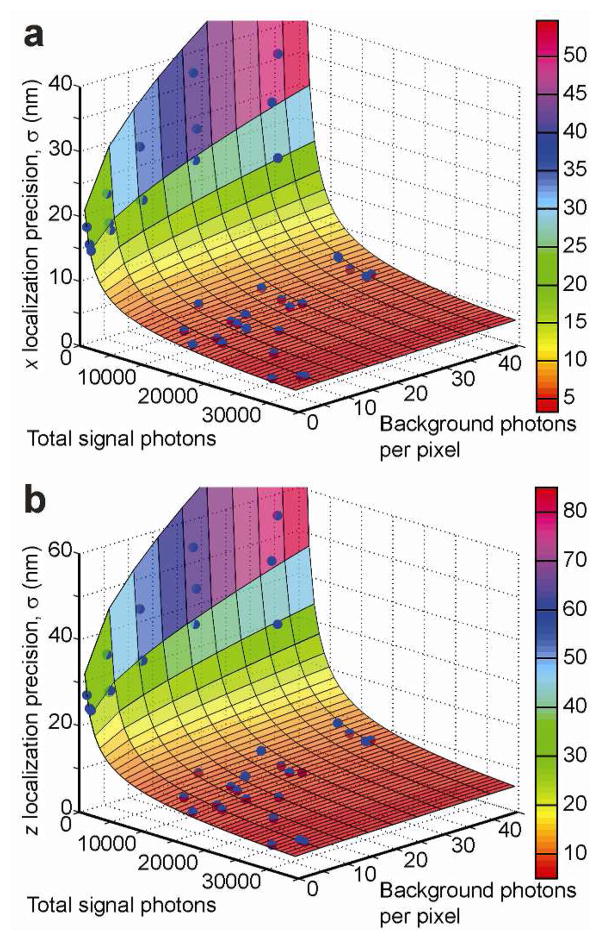
Figure 2.
3D Localization Precision. Dependence of the experimentally obtained localization precision on the measured signal and background levels in a the transverse (shown is x) dimension and b the axial (z) dimension. Also shown are the best-fit surfaces based on the model of Equation 1. The residual errors of the fit are bounded by the 15% error margin in all dimensions.

