Figure 4.
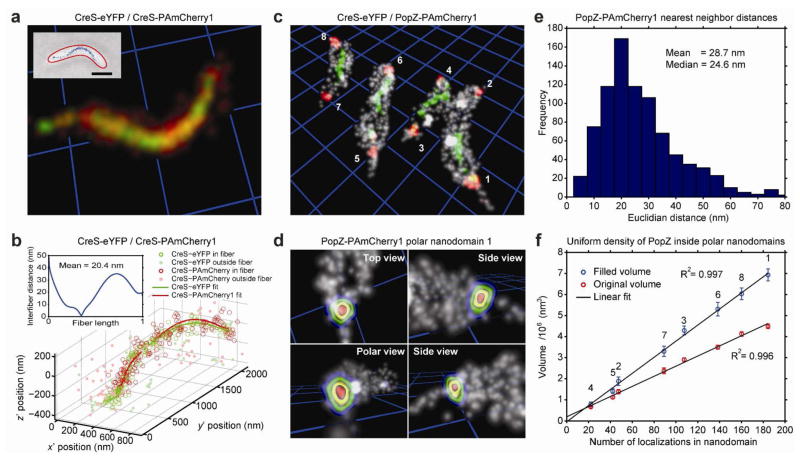
Two-color super-resolution imaging in live Caulobacter cells. a The fully characterized mapping function produces high-quality 3D overlap of CreS-eYFP (green) and CreS-PAmCherry1 (red) labels that are incorporated into the same CreS fiber (fiber 3, Supplementary Figure 3) in a live JP431 Caulobacter cell (inset). Single-molecule localizations are visualized as Gaussian spheres of width σ equal to the average localization precision. Yellow/orange volumes mark regions of mixing between eYFP and PAmCherry1 localizations. Brightness and contrast of the image are adjusted to emphasize the high density of molecules attached to the fiber, rather than isolated single molecules. Gridline spacing (blue) and scale bar is 1 μm. For an animated sweep through this volume, see Supplementary Movie 2. b Parametric helical fits to CreS-eYFP (green) and CreS-PAmCherry1 (red) localizations of fiber 2. Empty circles denote localizations within 3.5w of the calculated radial distributions and filled circles denote cytosolic localizations that were not included in the fit (Supporting Information). The histogram inset shows the shortest Euclidian distances between the two helical fits over the normalized length of the CreS-PAmCherry1 fiber. c Multicolor 3D reconstruction of the CreS-eYFP fiber (green), PAmCherry1-PopZ polar nanodomains (red), and the Caulobacter cell surface (gray) in strain JP432. Gridline spacing (blue) is 1 μm. For an animated sweep through this volume, see Supplementary Movie 3. d PopZ nanodomain 1 fills a large portion of the polar space (perspective rendering; contours delineate increasing PAmCherry1-PopZ probability density enclosed within the nearby surface PAINT localizations in gray, see also Supplementary Movie 4). e Measured nearest neighbor distances between individual PAmCherry1-PopZ localizations within polar nanodomains 1–8 indicate fairly dense sampling. f Estimated volumes of the indicated PopZ nanodomains before and after filling unsampled spaces in the interior of the clustered PAmCherry1-PopZ localizations. Error bars are ± 1 s.d. (Supporting Information). Both the filled and unfilled volumes correlate linearly with the measured number of PAmCherry1-PopZ localizations.

