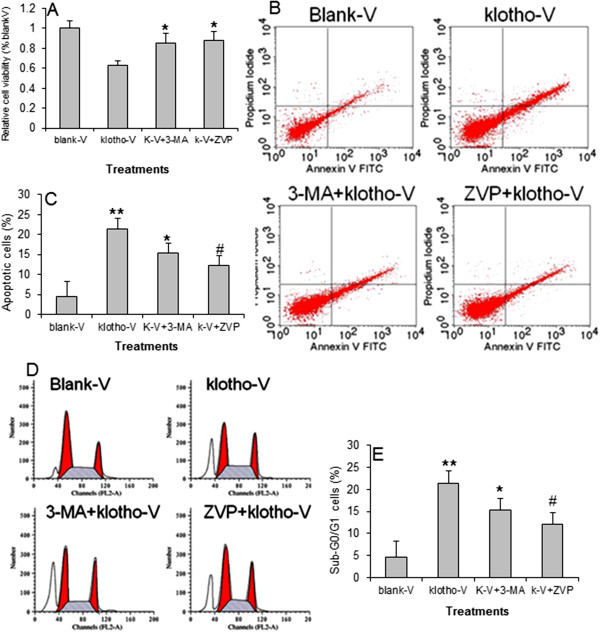
Figure 6.
The roles of apoptosis and autophagy inhibitors on apoptosis and cell cycle. A) Relative cell viability in GC-7901 cell transfected with blank vector (blank-V), klotho expression vector (klotho-V), or klotho vector plus 3-MA (k-V + 3-MA), or Z-VAD-PMK (k-V + ZVP) incubation. *p < 0.01 vs. klotho-V. N = 5. B) Flow cytometry of cell apoptosis in GC-7901 cells transfected with blank vector (blank-V) or klotho expression vector (klotho-V), transfected with klotho expression vector plus 3-MA (K-V + 3-MA), or Z-VAD-PMK (k-V + ZVP) incubation. C) Percentage of apoptotic cells in B). **p < 0.001 vs. blank-V, *p < 0.05 vs. klotho-V. #p < 0.01 vs. klotho-V. N = 5. D) Flow cytometry of cell cycle analysis. E) Percentage of sub-G0/G1 cells in D). **p < 0.001 vs. blank-V, *p < 0.05 vs. klotho-V. #p < 0.01 vs. klotho-V. N = 5.

