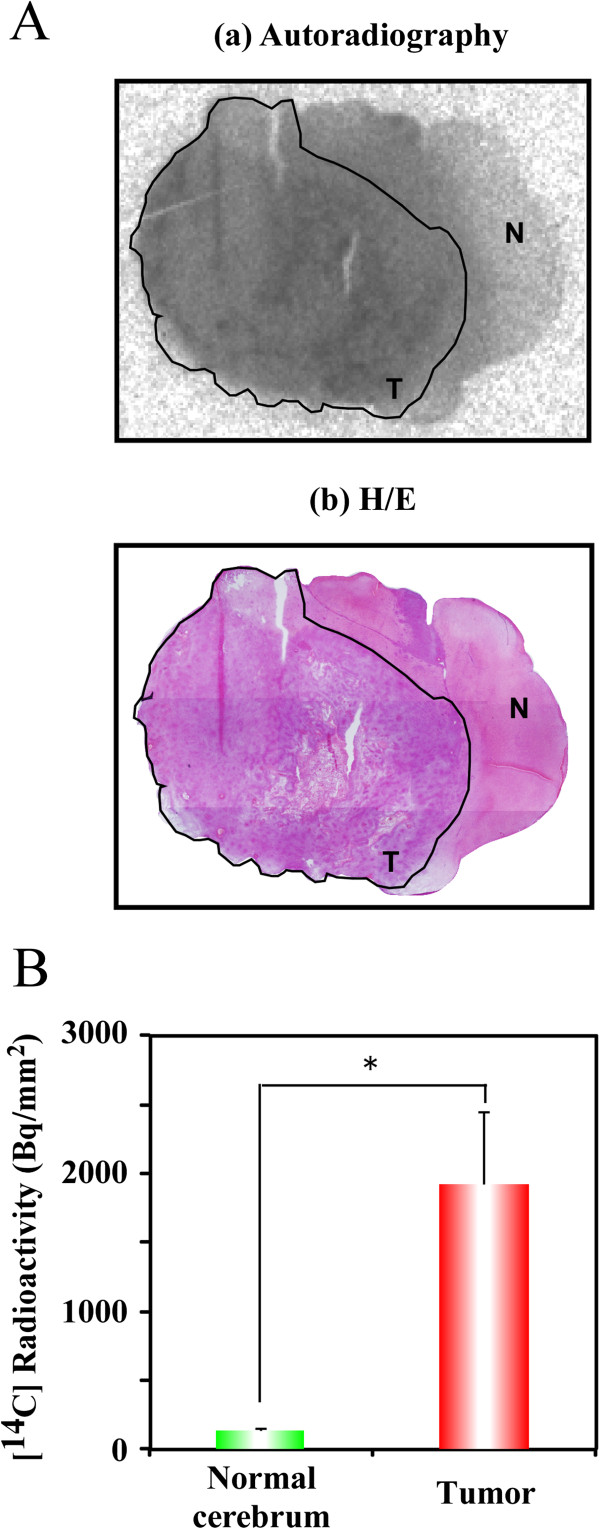
Figure 3.
The distribution of [14C]-doranidazole in C6 intracranial glioma. (A) A 20-μm thick tissue section of rat brain that was used for autoradiography (a) and subsequent H/E staining (b). Black lines show the C6 glioma. The annotated words “T” and “N” represent tumor and normal brain regions, respectively. (B) Using these images, quantitative data for the accumulation of [14C]-doranidazole in normal cortex and C6 glioma was acquired. Data are expressed as the mean ± S.E. for four different tumors. *: P < 0.05 vs. normal cerebrum.

