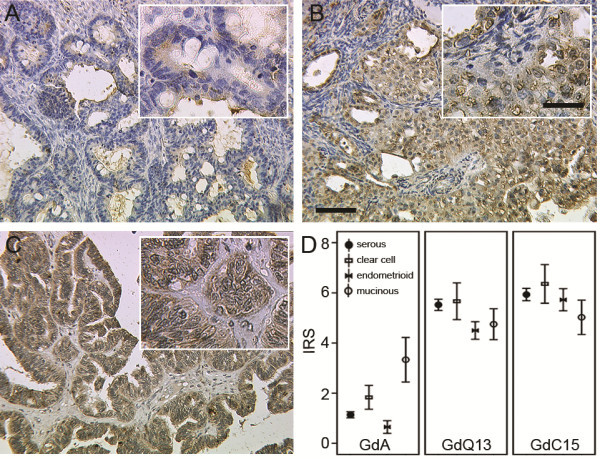
Figure 1.
Immunohistochemical staining of GdA (A), GdQ13 (B) and GdC15 (C). Representative images of GdA (A), GdQ13 (B) and GdC15 (C) are shown. GdA expression in mucinous cancers was significantly higher than in the remaining entities (D; p = 0.007). Mean IR-scores for GdA, GdQ13 and GdC15 are shown (D); error bars represent standard error. Scale bar in B equals 100 μm (50 μm in insert) and applies to A - C.

