
Figure 2.
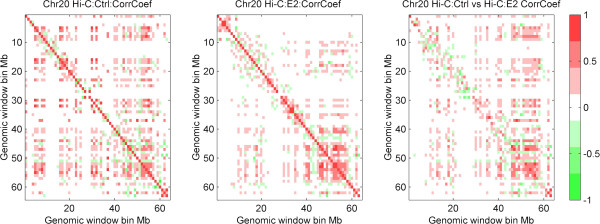
Correlation coefficient matrices of intra-chromosomal interactions. Left, middle and right panel represent colored heat map of correlation coefficient matrices of chromosome 20 intra-chromosomal interactions (1 Mb resolution) in control condition, E2-treated condition, and between control and E2-treated conditions, respectively. Here positive and negative correlation coefficients are color scaled to red and green, respectively.