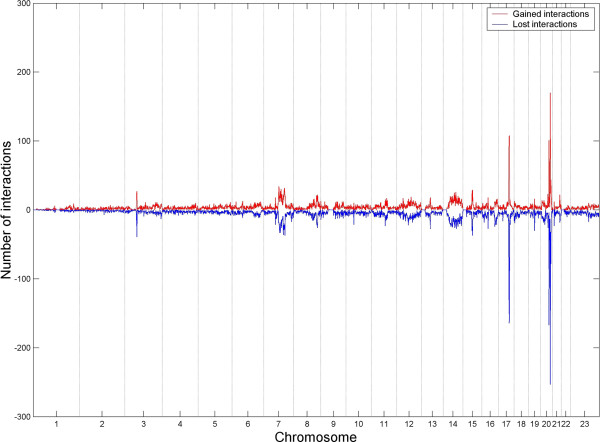
Figure 4.
Dynamical changes of chromosomal interactions between control and E2-treated conditions. Number of gained (i.e. red smooth line, positive value) and lost (i.e. blue smooth line, negative value) interactions between control and E2-treatd conditions are calculated for every 1 Mb region of human genome based on the four types of the strongest chromosomal interactions (i.e. strong differential gain or loss chromosomal intra or inter interactions, Additional file 7).

