
Figure 5.
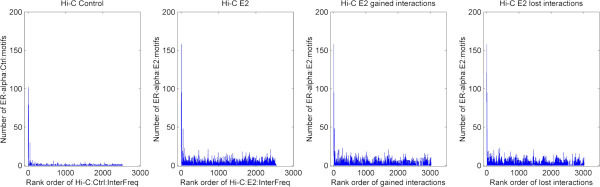
Association of chromosomal interaction frequency and ER-alpha binding motifs. ER-alpha binding motifs are identified by applying peak calling program wBELT on public available ER-alpha Chip-Seq experiments. Then the number of ER-alpha binding motifs in every 1 Mb region of human genome is plotted against to the rank order of local chromosomal interaction frequencies in Hi-C experiments. Figures from the left to the right represent such plot in Hi-C control, E2-treated, E2-treated gained interaction only and E2-treated lost interaction only conditions, respectively.