
Figure 6.
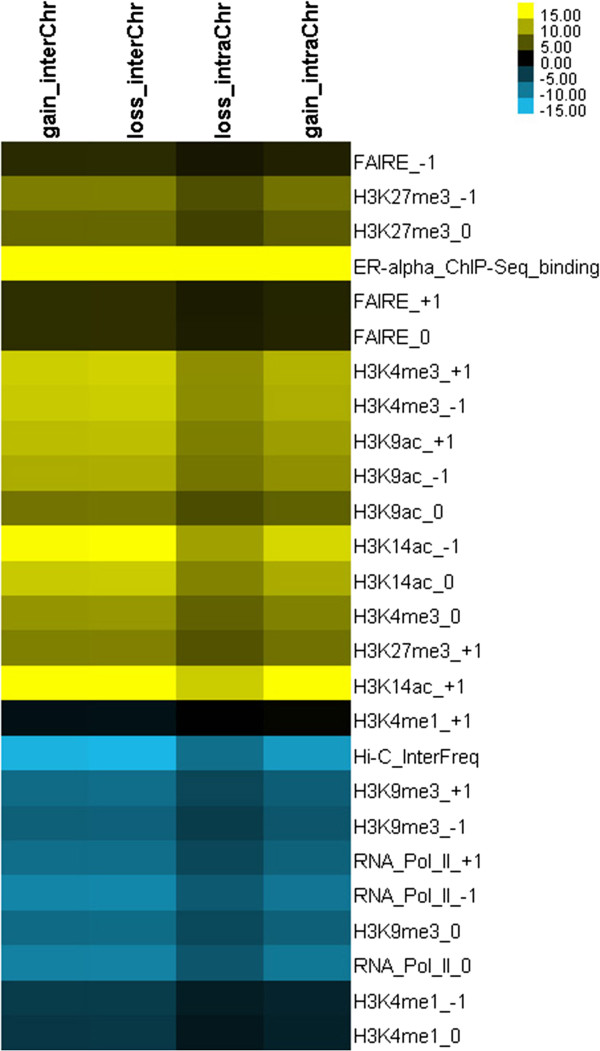
A heat map of change of histone modifications between E2-treated and control conditions for four types of chromosomal interactions. Here T-values are obtained by perform t-test for genes that were chosen by the identified four types of chromosomal interaction changes (e.g., gain strong inter-chromosomal interaction, loss strong inter-chromosomal interaction, gain strong intra-chromosomal interaction and loss strong intra-chromosomal interaction, detailed information please refer to Additional file 7). The T-test was used to evaluate significance of dynamical change of various marks between E2-treated and control conditions (1 Mb resolution), positive and negative T-values are colored by yellow and blue, respectively. In the figure, 0, +1 and −1 represent E2 treated condition vs. control condition at gene body, 5 kb upstream and 5 kb downstream, respectively.