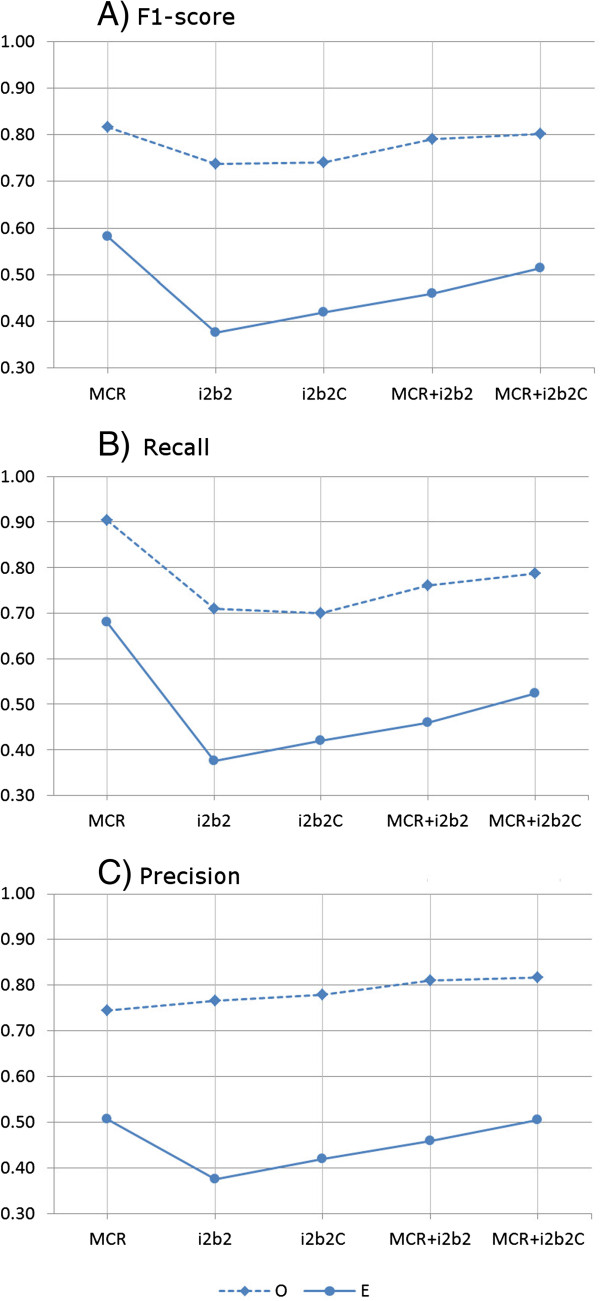
Figure 3.

Performance measures of the taggers trained on the curated i2b2 corpus and tested on MCR corpus. The plots A, B and C show the F1-score, precision and recall respectively. There are two lines in each plot that correspond to the two evaluation methods: Exact (E) with solid lines and Overlap (O) with dashed lines. The horizontal axis indicates the training sets: i2b2, i2b2C (curated), MCR + i2b2 (combined) and MCR + i2b2C (MCR combined with curated i2b2).
