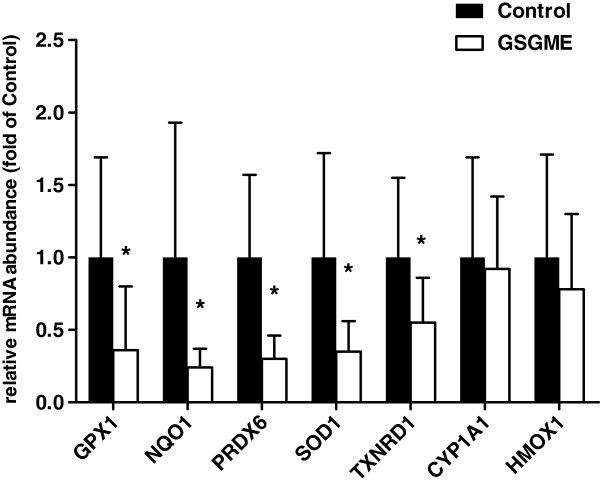
Figure 4.
Relative mRNA abundance of Nrf2 target genes GPX1, NQO1, PRDX6, SOD1, TXNRD1, CYP1A1 and HMOX1 in the duodenal mucosa of pigs fed the control diet or GSGME containing diet. Bars represent mean ± SD of 12 pigs per group and are expressed as fold of relative mRNA abundance of the control group. *Significantly different from the control group; P < 0.05.

