
Figure 4.
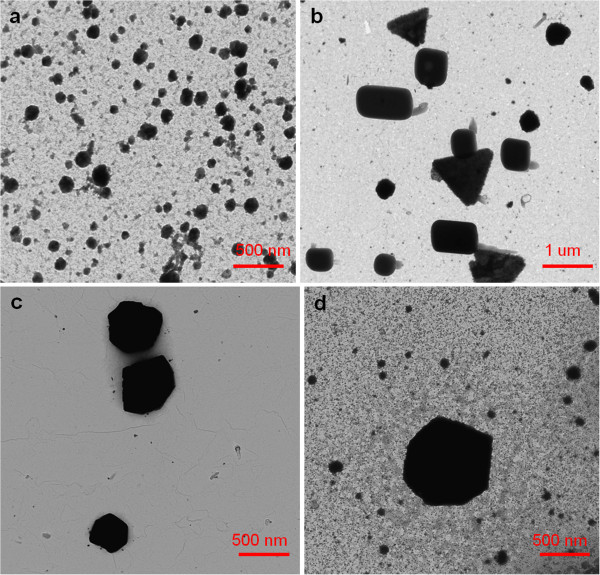
TEM micrographs that show the formation of AgNPs with different shapes for different PAA concentrations. (a) Spherical shape for 2.5 mM PAA. (b) Several shapes (triangle, rod, cube, bar) for 10 mM PAA. (c, d) Hexagonal shapes for 100 and 250 mM PAA, respectively. The DMAB concentration was 0.33 mM.